Week 2 Assignment Frequency Tables
Question
A data set is summarized in the frequency table below. Using the table, determine the number of values less than or equal to 7 in the data set. Give your answer as a single number. For example if you found the number of values was 16, you would enter 16.
| Value | Frequency |
| 3 | 8 |
| 4 | 4 |
| 5 | 3 |
| 6 | 2 |
| 7 | 2 |
| 8 | 7 |
| 9 | 3 |
| 10 | 6 |
| 11 | 3 |
| 12 | 7 |
Question
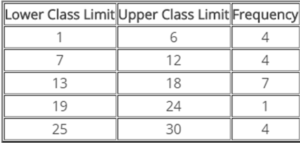
As the manager of a store, you wish to determine the amount of money that people who visit this store are willing to spend on impulse buys on products placed near the checkout register. You sample twenty individuals and record their responses. Construct a frequency table for grouped data using five classes.
8,18,15,10,29,4,15,2,4,9,16,14,13,8,25,25,27,1,15,24
Provide your answer below:
Question
A group of students were surveyed about the number of times they went to a movie theatre last year. Their responses are summarized in the relative frequency table below.
What is the cumulative relative frequency of students that went to 7 or fewer movies?
| Number of Movies | Relative Frequency |
| 0−1 | 0.08 |
| 2−3 | 0.20 |
| 4−5 | 0.30 |
| 6−7 | 0.24 |
| 8−9 | 0.10 |
| 10 or more | 0.08 |
Question
Given the relative frequency table below, which of the following is the corresponding cumulative relative frequency table?
| Value | Frequency |
| 4 | 0.35 |
| 5 | 0.2 |
| 6 | 0.05 |
| 7 | 0.4 |
Question
A group of students were surveyed about the number of siblings they have. The frequencies and relative frequencies of their responses are shown in the below.
Complete the cumulative relative frequency table.
| Number of Siblings | Relative Frequency |
| 0 | 0.18 |
| 1 | 0.33 |
| 2 | 0.16 |
| 3 | 0.14 |
| 4 or more | 0.19 |
Provide your answer below:
Question
Given the relative frequency table below, which of the following is the corresponding cumulative relative frequency table?
| Value | Frequency |
| 4 | 0.28 |
| 5 | 0.24 |
| 6 | 0.04 |
| 7 | 0.2 |
| 8 | 0.24 |
Question
A small start-up company wishes to know how many hours, per week, that its employees spend commuting to and from work. The number of hours for each employee are shown below. Construct a frequency table for grouped data using four classes.
9, 18, 18, 14, 13, 4, 12, 9, 13, 10, 20, 12, 19, 20, 13, 3, 5, 20, 17, 1
Provide your answer below:
Question
William wishes to view a frequency table for grouped data using his monthly credit card statements for the last 20 months, shown below. Construct the table for William using six classes.
1312, 1303, 809, 1477, 1263, 1444, 894, 1051, 1485, 1433, 1132, 1221, 1179, 945, 995, 1179, 1172, 1373, 906, 955
Provide your answer below:
Solution :
Question
A data set is summarized in the frequency table below. Using the table, determine the number of values less than or equal to 7 in the data set. Give your answer as a single number. For example if you found the number of values was 16, you would enter 16.
| Value | Frequency |
| 3 | 8 |
| 4 | 4 |
| 5 | 3 |
| 6 | 2 |
| 7 | 2 |
| 8 | 7 |
| 9 | 3 |
| 10 | 6 |
| 11 | 3 |
| 12 | 7 |
Answer: 19
Question
As the manager of a store, you wish to determine the amount of money that people who visit this store are willing to spend on impulse buys on products placed near the checkout register. You sample twenty individuals and record their responses. Construct a frequency table for grouped data using five classes.
8,18,15,10,29,4,15,2,4,9,16,14,13,8,25,25,27,1,15,24
Provide your answer below:

Question
A group of students were surveyed about the number of times they went to a movie theatre last year. Their responses are summarized in the relative frequency table below.
What is the cumulative relative frequency of students that went to 7 or fewer movies?
| Number of Movies | Relative Frequency |
| 0−1 | 0.08 |
| 2−3 | 0.20 |
| 4−5 | 0.30 |
| 6−7 | 0.24 |
| 8−9 | 0.10 |
| 10 or more | 0.08 |
Answer: 0.82
Please click the icon below to purchase full answer at only $10
