Week 3 Assignment Distribution shape
Question
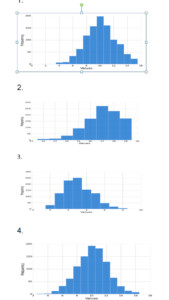
Which of the following histograms shows a skewed data set?
Select all correct answers.

1.
2.
3.
4.
Question
A data set of the population densities of 15 U.S. states has a mean of 154 and a median of 94. Which of the following is a logical conclusion?
Select the correct answer below:
The data are skewed to the left.
The data are skewed to the right.
The data are symmetrical.
Question
Which of the following frequency tables show a skewed data set? Select all answers that apply.
Select all that apply
| Value | Frequency |
| 5 | 2 |
| 6 | 5 |
| 7 | 9 |
| 8 | 15 |
| 9 | 18 |
| 10 | 24 |
| 11 | 19 |
| 12 | 15 |
| 13 | 10 |
| 14 | 4 |
2.
| Value | Frequency |
| 13 | 2 |
| 14 | 5 |
| 15 | 14 |
| 16 | 13 |
| 17 | 23 |
| 18 | 26 |
| 19 | 15 |
| 20 | 2 |
3.
| Value | Frequency |
| 5 | 1 |
| 6 | 1 |
| 7 | 9 |
| 8 | 20 |
| 9 | 24 |
| 10 | 20 |
| 11 | 9 |
| 12 | 4 |
| 13 | 1 |
| 14 | 1 |
| 15 | 1 |
4.
| Value | Frequency |
| 0 | 4 |
| 1 | 12 |
| 2 | 23 |
| 3 | 28 |
| 4 | 17 |
| 5 | 7 |
| 6 | 6 |
| 7 | 3 |
Correct answer: table 2&4
Question
Which of the following frequency tables show a skewed data set? Select all answers that apply.
Select all that apply:
| Value | Frequency |
| 0 | 2 |
| 1 | 11 |
| 2 | 30 |
| 3 | 22 |
| 4 | 15 |
| 5 | 12 |
| 6 | 6 |
| 7 | 1 |
| 8 | 1 |
| Value | Frequency |
| 4 | 1 |
| 5 | 2 |
| 6 | 3 |
| 7 | 7 |
| 8 | 19 |
| 9 | 17 |
| 10 | 17 |
| 11 | 15 |
| 12 | 12 |
| 13 | 4 |
| 14 | 1 |
| 15 | 2 |
| Value | Frequency |
| 13 | 1 |
| 14 | 6 |
| 15 | 9 |
| 16 | 15 |
| 17 | 27 |
| 18 | 28 |
| 19 | 10 |
| 20 | 4 |
| Value | Frequency |
| 3 | 1 |
| 4 | 0 |
| 5 | 1 |
| 6 | 5 |
| 7 | 9 |
| 8 | 12 |
| 9 | 12 |
| 10 | 18 |
| 11 | 12 |
| 12 | 17 |
| 13 | 11 |
| 14 | 0 |
| 15 | 1 |
| 16 | 0 |
| 17 | 1 |
Question
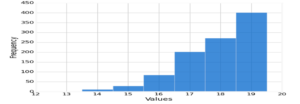
Given the following histogram, decide if the data is skewed or symmetrical.

Select the correct answer below:
The data are skewed to the left.
The data are skewed to the right.
The data are symmetric
Question
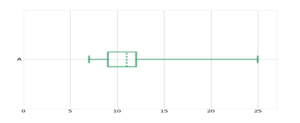
Given the following box-and-whisker plot, decide if the data is skewed or symmetrical.

The data are skewed to the left.
The data are skewed to the right.
The data are symmetric
Question
Which of the following frequency tables shows a skewed data set? Select all answers that apply.
Select all that apply:
| Value | Frequency |
| 7 | 4 |
| 8 | 8 |
| 9 | 12 |
| 10 | 16 |
| 11 | 15 |
| 12 | 13 |
| 13 | 10 |
| 14 | 5 |
2.
| Value | Frequency |
| 5 | 3 |
| 6 | 3 |
| 7 | 8 |
| 8 | 12 |
| 9 | 15 |
| 10 | 19 |
| 11 | 19 |
| 12 | 10 |
| 13 | 4 |
| 14 | 3 |
| 15 | 3 |
| 16 | 1 |
3.
| Value | Frequency |
| 12 | 1 |
| 13 | 2 |
| 14 | 3 |
| 15 | 13 |
| 16 | 10 |
| 17 | 26 |
| 18 | 25 |
| 19 | 15 |
| 20 | 5 |
4.
| Value | Frequency |
| 0 | 9 |
| 1 | 21 |
| 2 | 23 |
| 3 | 18 |
| 4 | 15 |
| 5 | 9 |
| 6 | 3 |
| 7 | 2 |
Solution:
Question
Which of the following histograms shows a skewed data set?
Select all correct answers.

Answer: image 2&3
Question
A data set of the population densities of 15 U.S. states has a mean of 154 and a median of 94. Which of the following is a logical conclusion?
Select the correct answer below:
The data are skewed to the left.
The data are skewed to the right.
The data are symmetrical.
Please click the icon below to purchase full answer at only $5
